
The headline number that set teeth on edge — $181,000 “per poor family” — rests on a math choice that even the Census Bureau says leaves out much of what government actually provides to low‑income Americans.
Story Snapshot
- The official poverty measure excludes noncash aid and tax credits, by design.
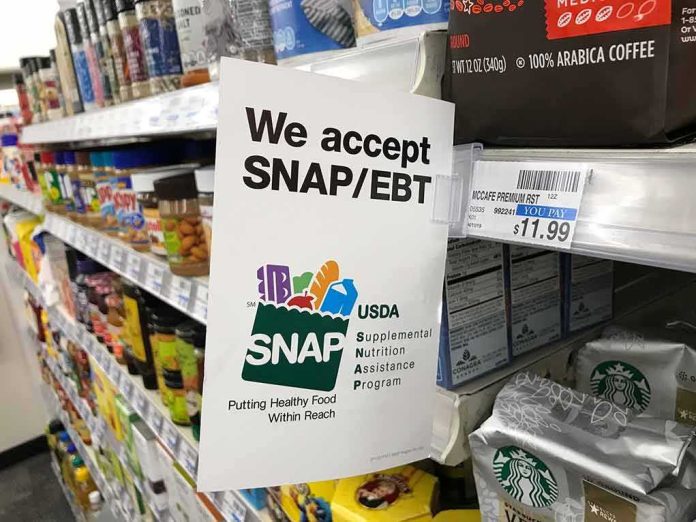
- Food and nutrition spending alone hit about $148 billion in fiscal year 2025, with 42 million monthly participants in the Supplemental Nutrition Assistance Program.
- A media estimate claims $1.256 trillion went to low‑income programs in 2025, framed as $35,000 per person in poverty and $181,000 per family.
- The Supplemental Poverty Measure shows how noncash benefits and taxes change poverty, which the official metric misses.
What the provocative “per family” number counts — and what it doesn’t
Townhall’s figure starts with a claimed $1.256 trillion total for large low‑income programs in fiscal year 2025, compiled from Office of Management and Budget data, then divides by the official count of people and families in poverty to reach $35,000 per person and $181,000 per family. The official poverty measure, however, excludes noncash benefits like Medicaid and the Supplemental Nutrition Assistance Program, housing aid, and refundable tax credits. Using that denominator can make the per‑family math look far larger than what any family receives in hand.
The mismatch is not a technical footnote; it is the whole ballgame. The official poverty count is a cash‑income yardstick. Major programs deliver help as health coverage, grocery benefits, and tax credits. That means the spending total and the poverty denominator are measuring different things. Critics see a bloated sum and stagnant official poverty. Supporters answer that the wrong ruler is being used to judge the impact. Both can cite real data, but they are playing on different fields.
The scale of aid is huge — and concentrated in a few programs
United States Department of Agriculture data show how large a single slice is. Federal spending on food and nutrition programs reached about $147.9 billion in fiscal year 2025. The Supplemental Nutrition Assistance Program accounted for $101.7 billion of that, with an average of 42.1 million people receiving benefits each month. Those numbers confirm that the system is not a niche. It is mainstream safety‑net policy touching tens of millions. Any per‑person division will therefore yield a large figure simply because the base is big.
At the same time, official poverty remains meaningful in size. Federal sources summarized 35.9 million people, including 10.4 million children, living below the official poverty line in 2024, with a 10.6 percent poverty rate. That stubborn level fuels the charge that large spending is not buying lower poverty. The response from measurement experts is simple: the official line was never designed to count noncash help, so it will not show the full lift from programs that are not cash.
How a different measure changes the picture on results
The Supplemental Poverty Measure exists to add noncash aid and tax credits and subtract key expenses, so it can estimate how programs change poverty. The Census Bureau explains that this tool lets users see the antipoverty impact of benefits like the Supplemental Nutrition Assistance Program and refundable credits. A prior Census report found Social Security kept tens of millions out of poverty under this broader resource view, and refundable credits also had a large effect. The upshot: outcomes look different when we count what families actually use.
None of this proves every dollar is well spent. It does show the “$181,000 per family” line is an average of a broad outlay divided by a narrow count. That is not fraud; it is a framing choice. A common‑sense standard asks two things. First, measure programs by what they deliver and change in real life, not only by their price tag. Second, demand clear, program‑level audits on improper payments, overlap, and results. Voters deserve both an honest denominator and accountable dollars.
Sources:
townhall.com, census.gov, ers.usda.gov